
[Economic indicators for investors] are a compass for navigating the sea of data that defines today’s global markets, translating weekly and monthly releases into actionable context for portfolio choices, risk appetite, and long‑term planning, while guiding discussions about where opportunities and vulnerabilities are most likely to emerge across different regions, sectors, and asset classes. They help analysts assess where economic momentum is broadening or fading, balancing signals of economic growth and inflation with revisions and surprises that ripple through stock market indicators, bond yields, and currency markets, and they inform both tactical trades and structural investment theses across sectors like technology, manufacturing, and services. Understanding central bank policy impacts and the trajectory of policy rates is crucial, because changes in monetary stance tend to reprice risk assets, influence valuations, affect credit conditions, and shape market volatility analysis across asset classes while also guiding expectations for fiscal policy spillovers and currency strength. Viewed through a holistic lens, these indicators illuminate the interaction between consumer demand, business investment, and labor markets, enabling investors to calibrate exposure, diversify effectively, and anticipate how regional shocks might feed into global markets, as well as how geopolitical developments and commodity cycles could alter the macro chessboard. By following a disciplined, data‑driven framework, you can translate complex releases into intelligible scenarios, turning macro signals into smarter entry and exit points rather than reactive trades, and build resilience into portfolios by stress testing outcomes, tracking revision trends, and maintaining alignment with a long‑term financial plan.
Economic indicators for investors: Interpreting growth, inflation, and policy signals in global markets
Economic indicators for investors serve as the compass for understanding where the global economy is headed. Real GDP growth, unemployment rates, and consumer price measures reveal the momentum behind demand across regions. When growth accelerates and inflation remains contained, global markets often price in higher corporate earnings and supportive monetary conditions, with investors comparing the pace of expansion across the United States, Europe, Asia, and emerging markets.
Beyond the headline figures, the interaction of economic growth and inflation with central bank commentary helps map the risk landscape. Revisions to data, the trajectory of inflation expectations, and the tone of policy statements guide interpretations of market volatility analysis and the likely path of policy rates. This is the practical framework that turns raw numbers into actionable insights for stock market indicators and portfolio decisions across global markets.
Global markets and policy dynamics: Reading stock market indicators amid central bank impacts and volatility
Stock market indicators distill the macro story into forward-looking signals. Broad indices, earnings revisions, price-to-earnings ratios, and sector breadth capture how investors price growth and inflation expectations in the context of global markets. The level of market volatility analysis, often measured by proxies like the VIX, reveals risk appetite and helps identify rotation opportunities between cyclical and defensive assets as policy expectations evolve.
Understanding central bank policy impacts means tracking rate paths, balance sheet actions, and forward guidance across major economies. These moves shape cross-asset relationships—equity valuations, government bond yields, and currency dynamics—feeding into a cohesive market volatility analysis. By aligning stock market indicators with the broader macro narrative, investors can calibrate exposure, stress-test scenarios, and position portfolios for changing cycles across global markets.
Frequently Asked Questions
How do economic indicators for investors help interpret global markets and gauge central bank policy impacts on asset prices?
Economic indicators for investors provide a data‑driven view of where growth and inflation are headed and how policy signals may evolve. Key inputs include GDP growth, unemployment, inflation (headline and core), PMIs, and retail sales. When growth remains robust but inflation stays elevated, central banks may stay restrictive, impacting equities and longer‑duration bonds. Tracking stock market indicators and market volatility analysis helps you translate data into likely price moves and risk sentiment. Focus on forecast revisions, surprises versus consensus, and policy commentary to calibrate your asset mix, adjust duration, and implement scenario‑based risk controls rather than reacting to any single release.
Which stock market indicators and market volatility analysis signals are most informative for assessing economic growth and inflation trends for investors?
Stock market indicators and market volatility analysis translate macro data into investment implications. Monitor broad indices, earnings revisions, price/earnings ratios, and breadth to gauge how the market prices the growth and inflation outlook. Use volatility metrics such as the VIX to measure risk appetite and tail risk. When inflation accelerates alongside solid growth, valuations may reprice higher or yields rise; during softer inflation or rising volatility, quality and defensives may outperform. Combine these signals with macro data and central bank commentary to refine entry points, diversify across asset classes, and manage risk across regimes.
| Theme | Key Points | Implications for Investors |
|---|---|---|
| Global market context | Markets move on a chorus of data released across the United States, Europe, Asia, and emerging markets. Data shape portfolio choices, risk appetite, and long‑term plans. The article provides a framework to read signals and understand how data interacts with stock market indicators. | Use a broad, multi‑region view to gauge momentum and calibrate expectations for earnings, currency moves, and risk tolerance. Don’t overreact to a single data point; look for consistency and revisions. |
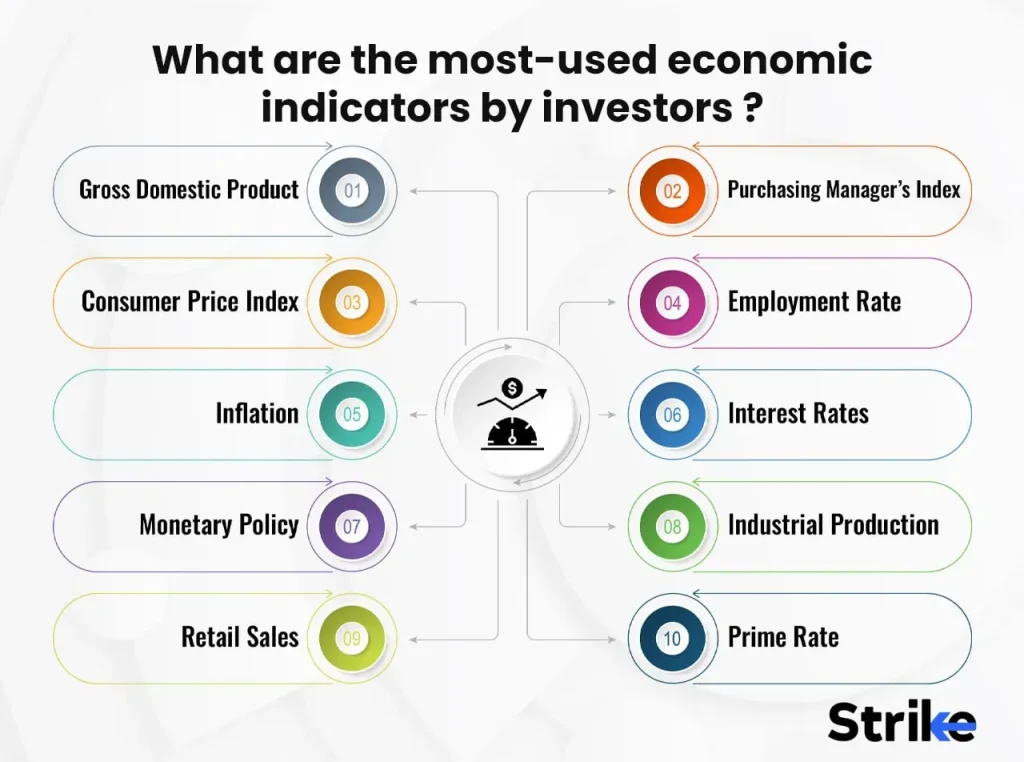
| Core indicators to track | Key indicators include growth (GDP, industrial production, capex), inflation (headline/core), labor data (unemployment, wages), consumer activity (retail sales, confidence, savings), and business sentiment (PMIs, surveys). International trade and commodity prices tie the macro story to the real economy. | Track a balanced mix across growth, inflation, labor, consumption, and sentiment to form a view on demand, pricing power, and policy risk. |
| Role of stock market indicators | Stock market indicators reflect the macro environment and investors’ expectations. Examples include broad indices (e.g., S&P 500), earnings revisions, P/E ratios, sector breadth, and VIX. Cross‑asset relationships (rates, bonds, gold) matter. | Use these to gauge valuation, momentum, and risk appetite; higher rates often compress equity valuations, and risk off moves can shift demand to bonds or gold. |
| Inflation, growth, and risk sentiment | The relationship between inflation, real growth, and risk sentiment is central. If inflation decelerates and growth reaccelerates, valuations may rise; surprises in inflation or growth can trigger corrections. Dispersion across economies affects asset allocation and hedging needs. | Assess cross‑country differences and adapt allocations to where inflation and growth dynamics are most favorable; diversify to manage dispersion risk. |
| Central bank policy & global rates | Policy rates, forward guidance, and balance sheet actions drive macro expectations and asset prices. Tightening can dampen growth and inflation; easing can support risk assets. Policy direction and coordination influence capital flows and currency movements. | Align exposure with the most likely policy regime over the investment horizon; avoid overreacting to every data release and consider duration, inflation risk, and rate expectations. |
| Practical implications for portfolio strategy | Diversification across equities, fixed income, real assets, and cash; focus on quality earnings, durable cash flow, and appropriate bond duration; monitor factor exposures (value, momentum, quality, low vol) and manage risk via stop losses and scenario planning. | Implement a flexible, data‑driven approach with a watch list for data and policy events to translate macro signals into disciplined, actionable decisions. |
| Interpreting data with a long‑term lens | Value comes from interpreting revisions, central bank commentary, and cross‑indicator consistency rather than one‑off spikes. Maintain a long‑horizon view and let data corroborate trends. | Avoid chasing noise; wait for corroboration across indicators before changing course; stay focused on the big macro narrative and potential outcome scenarios. |
| What this means for you today | For investors navigating global markets, start with core indicators and how they interact with policy signals to form a framework for asset allocation and hedging strategies. | Use the framework to plan for scenarios where growth slows or inflation accelerates, translating macro signals into purposeful, well‑considered investment moves. |
Summary
Conclusion: The key takeaways from the base content are that global markets are driven by a chorus of indicators across growth, inflation, policy, and risk sentiment. Investors benefit from a disciplined framework that integrates diverse data signals, monitors central bank actions, and remains flexible to changing conditions while maintaining a long‑term perspective.